This blog by HEPI was kindly authored by, from the Higher Education Statistics Agency (HESA), Lucy Van Essen-Fishman, Policy and Research Manager; and from the National Technician Development Centre (NTDC), Dr. Sara Bacon, Centre Manager; Jared Carnie, Operations Manager And Skills Audit Officer; Ollie Manton, Survey Officer; and Savannah Lawson, Marketing And Communications Officer.
In autumn 2022, HEPI and Midlands Innovation released a ten-part blog series on technical talent, reflecting a growing interest in technicians in the higher education and research sectors. There is a particular interest in understanding employment quality for technicians, encompassing skills utilisation, career development opportunities, pay and contract terms.
Information collected about technicians, however, is incomplete, leaving gaps in our understanding of how their demographic and employment characteristics compare to those of other higher education workforce segments. To address these gaps, we compared the National Technician Development Centre’s Technician Survey data with equivalent data on academic staff from the HESA Staff record.
Data on technicians
The HESA Staff record collects data on the personal characteristics, activities and employment terms of staff employed by UK higher education providers. Technicians are classified as non-academic staff for the purposes of the Staff record, and, as such, the return of data on technicians has been optional for providers in England and Northern Ireland since 2019.
Other information on technicians, however, is available. In 2017, the National Technician Development Centre (NTDC) was established to support career development pathways for technical staff. In order to increase understanding of technical roles and to support workforce planning, the NTDC administer the Technician Survey to participating institutions. The survey collects data on the demographic characteristics of technical staff, alongside their employment terms, technical skills and responsibilities, career plans and development needs.
Comparing technicians with academic staff
Academic staff are arguably the most visible part of the higher education workforce. HEPI therefore considered that a comparison of technical and academic staff could help to put the technical workforce in context. Looking at data on technical staff from the NTDC Technician Survey and data on academic staff from the HESA Staff record, HEPI sought to compare some of the key characteristics of the two groups. We restricted our sample of academic staff to the 18 providers also participating in the Technician Survey, giving a total of 3,100 technicians and 49,425 academic staff members.
The characteristics of the technical workforce
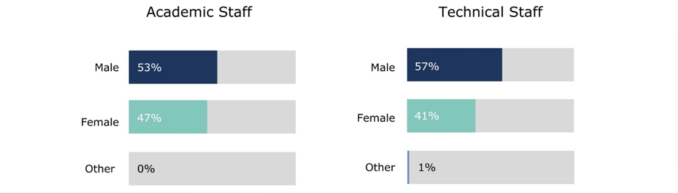
HEPI saw both similarities and differences in the demographic characteristics of technicians and academic staff. Disability rates were comparable, but HEPI saw a higher percentage of male technicians (57%) than male academic staff (53%) as well as higher percentages of technical staff in the youngest and oldest age bands.
Figure 1. Gender of academic and technical staff
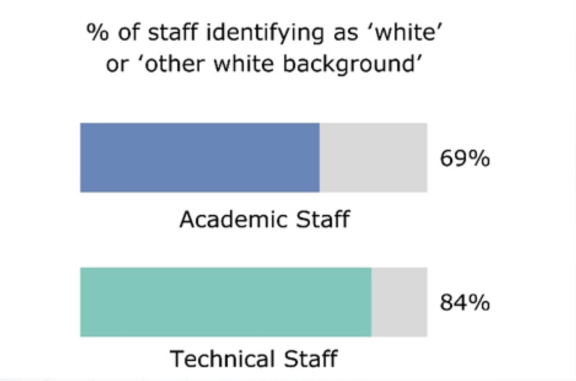
HEPI also saw differences when looking at ethnicity, with 69% of academic staff identifying as ‘white’ or ‘other white background’, compared to 84% of technicians. For both datasets, the number of staff in individual non-white ethnicity categories was small enough to make meaningful comparison difficult.
Figure 2. Ethnicity of academic and technical staff
When HEPI looked at qualifications, they saw that 77% of technicians held a first degree or above, indicating a highly qualified population, albeit with fewer doctorates compared to academic staff. HEPI saw a trend of increasing qualifications among younger technicians, which suggests an even more highly qualified technical workforce in the future. As older technicians retire, it seems likely that the proportion of the technical workforce holding higher qualifications will increase.
Figure 3. Qualifications held by academic and technical staff
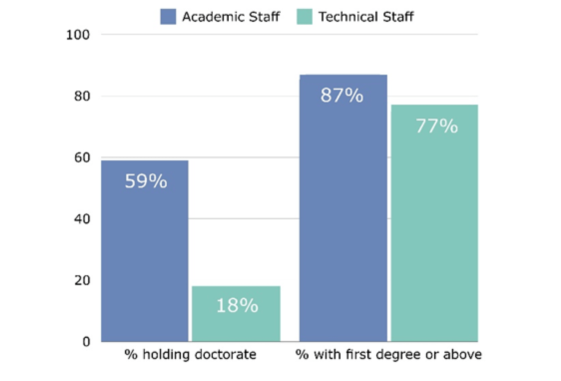
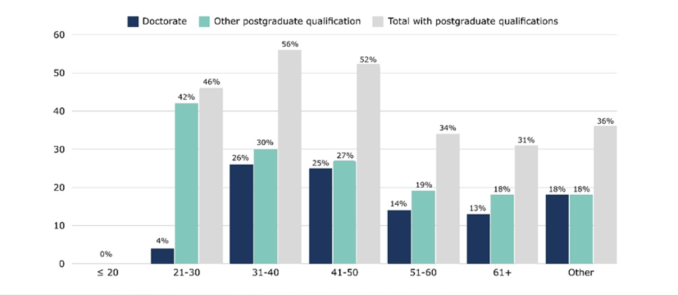
Figure 4. Qualifications held by technical staff in different age groups
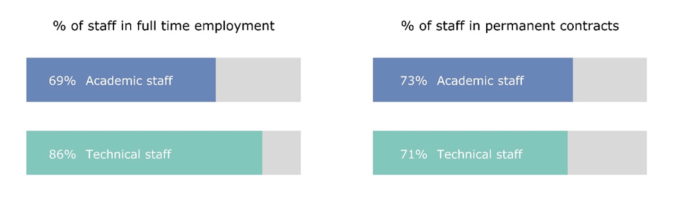
Looking at employment characteristics, technical and academic staff had similarities in contract types but differences in working patterns. 73% of academic staff and 71% of technical staff were employed on permanent contracts. On the other hand, 86% of technical staff were in full-time employment compared to 69% of academic staff, suggesting favourable employment conditions for technicians in this regard.
Figure 5. Terms of employment for academic and technical staff
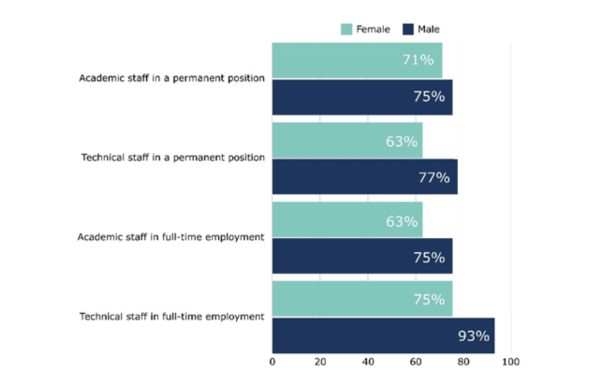
For both academic and technical staff, terms of employment varied by gender, with a more pronounced gender gap among technicians. Some 75% of male academics and 71% of female academics hold permanent positions. Among technicians, however, 77% of males hold permanent positions compared to only 63% of females.
Full-time work availability also varied by gender; 75% of male academics were employed full-time, compared to only 63% of female academics. As with contract type, the gender gap was more pronounced among technicians, with 93% of males working full-time, in contrast to 75% of female technicians and 86% of technicians overall. As a result, female technicians, while representing 41% of our technical population, represented 72% of part-time technical staff.
Figure 6. Terms of employment by gender for academic and technical staff
What have we learned about technicians?
Overall, HEPI’s comparison of technical and academic staff paints a mixed picture. On the one hand, they see that, in both academic and technical roles, men outnumber women and are more likely to be employed full-time. Amongst technical staff, this difference is magnified, with male technical staff 18 percentage points more likely to be working full-time than their female counterparts.
On the other hand, they see a technical workforce that compares favourably to the academic workforce in some regards. Although the difference in employment terms between male and female technicians is stark, both male and female technicians are more likely to be employed full-time than their academic counterparts; male technicians are also more likely to be employed on a permanent basis. This view of technicians as mostly full-time, frequently permanent members of staff supports anecdotal descriptions of technicians as repositories of institutional memory and a crucial ingredient in the glue that holds departments together.
The technicians in their dataset, moreover, were a highly qualified group, with 77% of all technical staff and 87% of those aged 21 to 30 qualified to first-degree level or higher. Some 71% of respondents to the NTDC Technician Survey said that their work supported teaching and 79% said that their work supported research. Although technicians are not classified as academic staff, these figures show that they are closely connected to the academic work that goes on in their institutions.
Their comparison of Technician Survey data with data on academic staff from the HESA Staff record gives HEPI a snapshot of how technicians fit into the higher education workforce. Their analysis suggests that technicians, as a group, are highly qualified and deeply embedded in the academic life of their institutions. Technicians are a unique group of staff in higher education institutions; collecting further comprehensive, sector-wide data on technicians could help both to support staff currently in technical roles and to encourage progress towards a more diverse technical workforce.
Original article source: https://www.hepi.ac.uk/2024/07/08/what-do-we-know-about-technicians/